TJOSTE
The project set out to use the data of the BmBF project 030G0541A to unravel
physical properties of the subsurface of the Tjörnes Fracture Zone north of Iceland surrounding the hydrothermal
fields and use them to model hydrothermal fluid circulation north of Iceland.
For the second part, however, funding was refused by the DFG, so that only
physical properties were extracted, mainly from two sources:
-the reflection seismic survey from the BmBF project and
-the earthquake catalogue from the South Iceland Lowland (SIL) network.
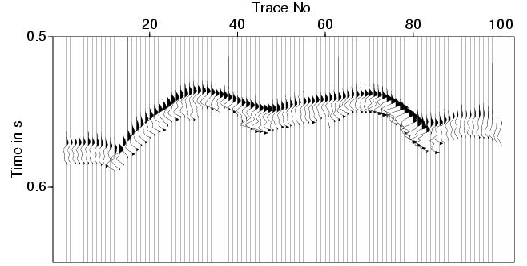
In the first part of our research the first reflection at various offsets was evaluated to quantify roughness and reflectivity of the seafloor. This was done in an automatised way by crosscorrelating seismic time series at the same offset at adjacent CDPs. A result of such an automatic extraction can be seen in Fig.1.
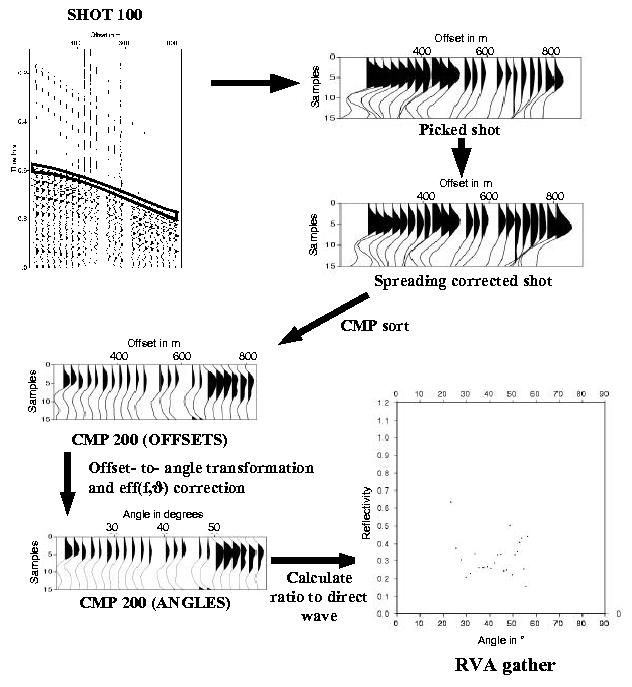
These data were then corrected by reducing noise (Butterwoth filter), deconvolving the source function of the airgun, inverting streamer array function characteristics (both by a wavelet transform technique) and evaluating geometrical spreading. These data were transformed from offset-dependent data to angle-dependent data (Figure 2).
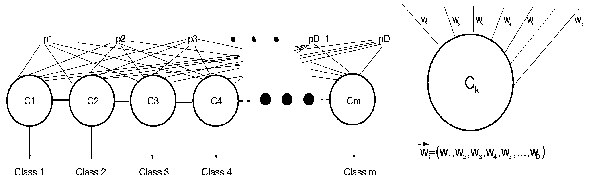
The angle dependent data were gridded by linear interpolataion between adjacent angles and were fitted into a neural Kohonen network consisting of a single layer of neurons in which each neuron is connected to each input grid cell (Figure 3), so that each neurons serves as a buffer for one class of trends within the input data.
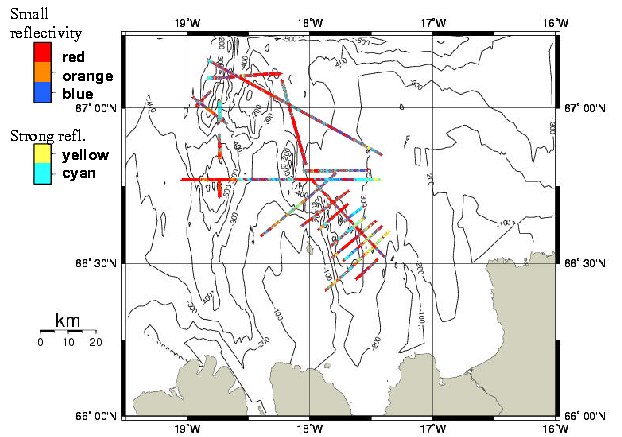
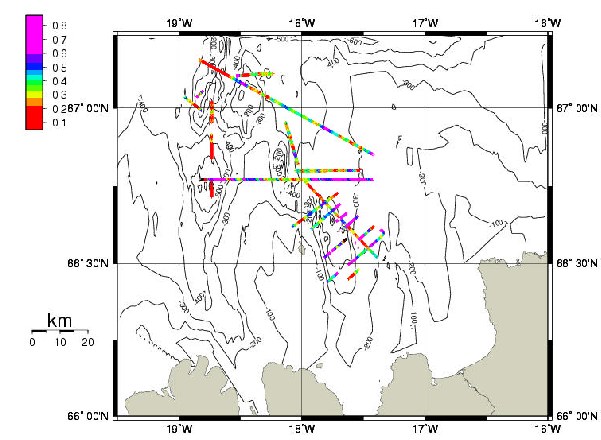
To optimise the Kohonen network it was evaluated with a variety of numbers of neurons and neurons that were only relevant for 10 or less trends observed in the data were dismissed along with the data assembling in them. The optimum number turned out to be 5, so that 5 classes could be provided for all the seismic profiles. The distribution of these classes in shown in Fig.4.
The five classes are marked by different colours. Their trends were evaluated by
a comparison to reflectivity calculated from Zoeppritz equations and
reflectivity codes from Wang called MSEIS and could subsequently be
qualitatively attached to lithological units:
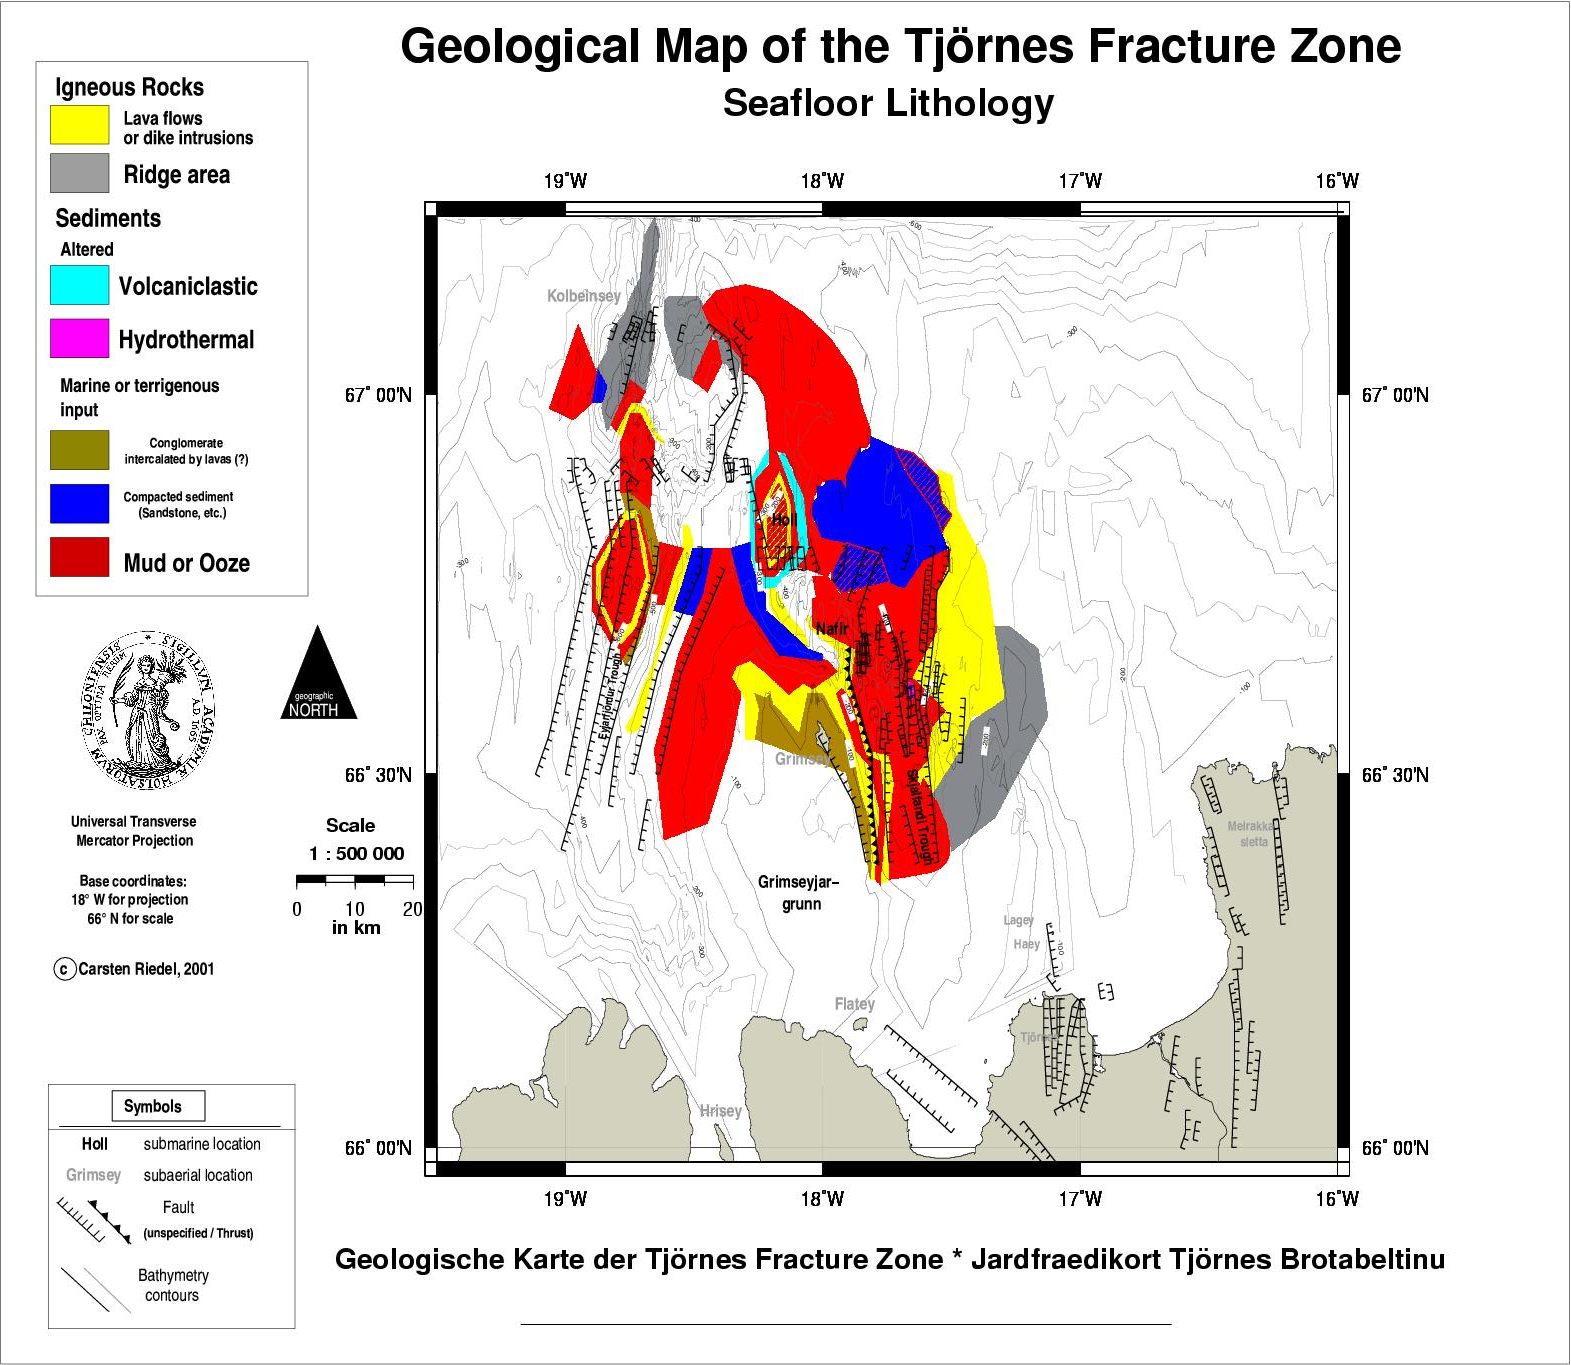
(a) red: sediments, soft, probably mud and ooze,
(b) orange: high amplitude in medium angles, otherwise soft, typical for
conglomerates etc.
(c) blue: sedimentary rocks with higher amplitudes than the soft sediments of
the red class, probably sandstone and pyroclastic rocks,
(d) yellow: igneous rocks, basalts and volcanic glass with a total reflection in
very low angles already,
(e) cyan: pyroclastic rocks and boulders, strong scattering of results.
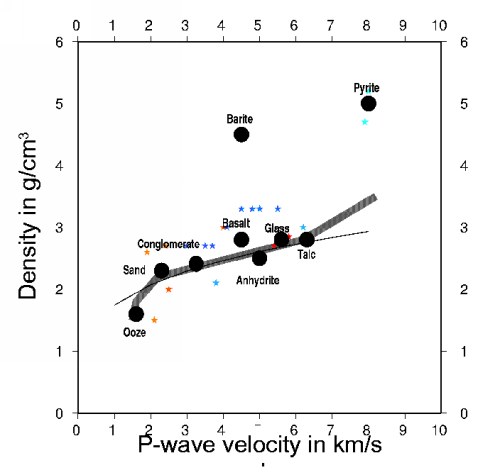
The results were also qualitatively and quantitatively compared to the rocks
sampled in the area (Figure 5).
to come to the conclusions above. Precipitates such as Barite and Pyrite are
probably so localized that they cannot be imaged because of the wide Fresnel
zone at the seafloor. Anhydrite and talc, although widespread, cannot be imaged because of
the similarity to Basalt.
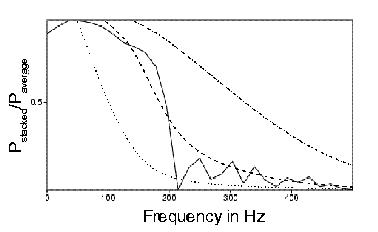
In a second step the roughness of the area was quantified by using a coherency function (CF). The actual function is described in the thesis. It evaluates the power spectra of adjacent CMPs and the stacked values of these power spectra. A typical curve is displayed in Figure 6.
Three model curves are drawn above it to visualize that the data can be modelled theoretically by using reasonable values for root-mean-square variation of seafloor height perturbation and their correlations in the two horizontal directions. In our approach we did not invert for these values and quantified roughness by coherency alone which is shown in Figure 7.
Finally, the roughness and reflectivity data were compared to lithological samples found in literature and a geological map was conceived for the submarine part of the TFZ, which is depicted in Figure 8 and can be downloaded at the top of this page.
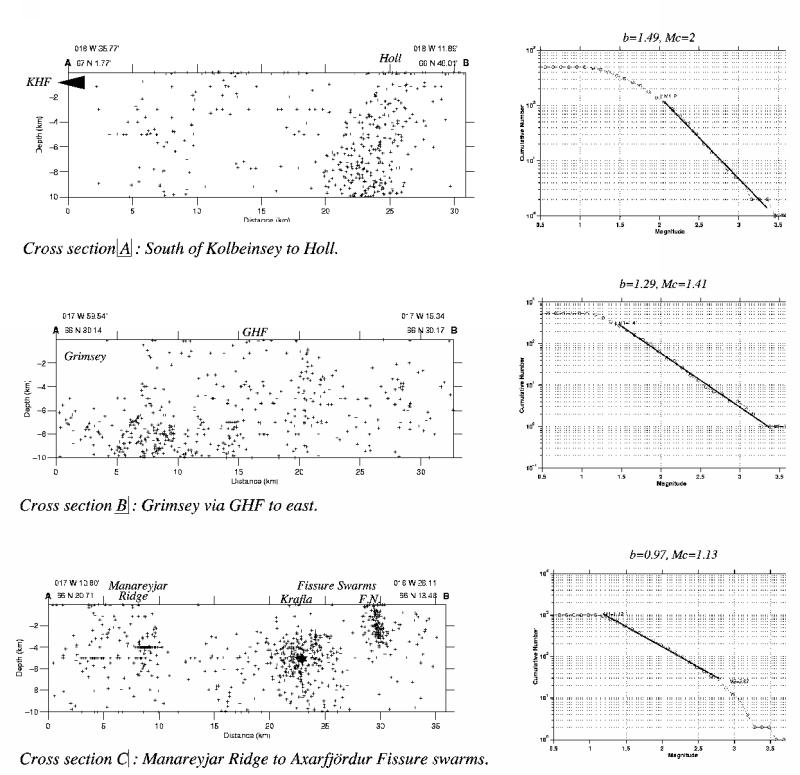
In the second part of TJOSTE, the SIL earthquake catalogue was evaluated statistically to identify areas of high b-values, which can proxies for magmatic fluids. The b-values were evaluated for three segments of the Grimsey Lineament, the northernmost lineament of the TFZ, manually by adapting a linear curve to the magnitude-frequency distribution (Figure 9) and automatically using the adaptation algorithm of ZMAP (Wiemer and Zuniga, 1994) .
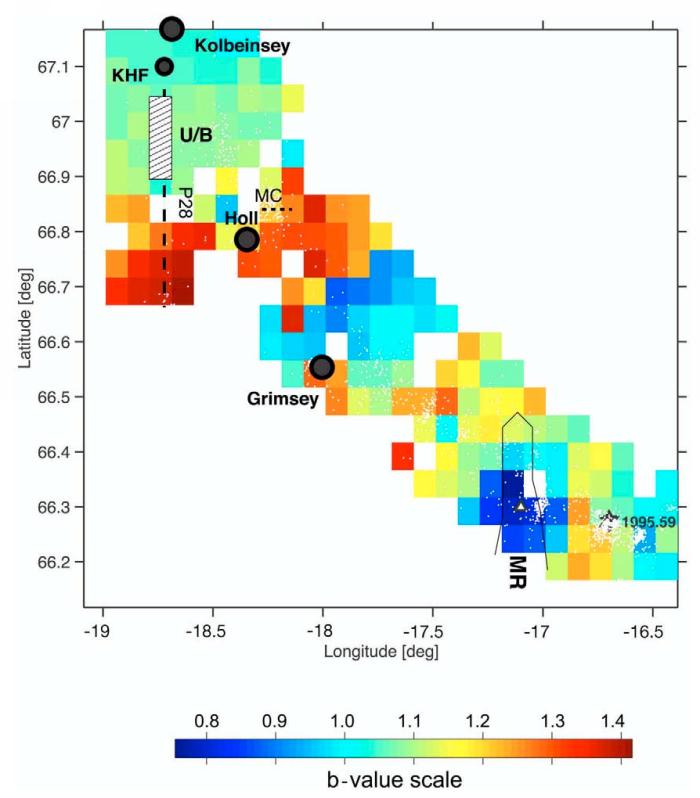
This algorithm was also used to map the b-value in more detail which is shown in Figure 10. In contrast to ther results of Figure 9, the statistical test for the b-values called Utsu test could only be easily performed for the three areas in Fig. 9 and the detailed map in Fig. 10 can only help in localising effects displayed in Fig.9. The area between Grimsey and Kolbeinsey island seems to be underlain by a sill, which was also imaged by reflection seismics indicated by MC on Fig.10.
Publications
JournalsC. Riedel et al., High b-values in the leaky segment of the Tjörnes Fracture Zone north of Iceland: are they evidence for shallow magmatic heat sources ?, JVGR, in press
Conferences
C. Riedel and T. Petersen, The origin of high b-values north of Iceland, ESC
Workshop on Volcano Seismology, Tenerife, 2001
Diploma theses
A. Broser (2000) AVO Untersuchungen
des Meeresbodens nördlich von Island, CAU
Kiel
T. Petersen (2000) Anzeichen für eine
Magmenkammer nördlich von Island, CAU Kiel